Multiple approach to improving the supply chain, Part III
Cooperation with Interested Parties
Food | Medicines

As discussed in the first two parts of this series (Part 1, Part 2), there are three key strategies in Sensitech's multi-layered approach to maximising the efficiency of supply chain data to improve quality and operational efficiency.
This article examines the use of integrated data and how it can help organizations drive continuous improvement through more effective stakeholder engagement such as vendors, carriers and receivers.
This can be achieved in many ways, such as sharing quality assurance standards (Qa), the allocation of responsibilities when overruns occur and the examination of data history throughout the supply chain, to identify opportunities for continuous improvement. Here are some examples:
Improved vendor liability
This Sensitech customer is a producer of organic chicken and the company uses real-time data devices to monitor temperatures during transport and manage delivery logistics.
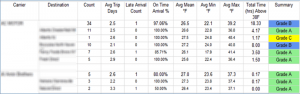
Sensitech helped the producer develop a “Carrier Rating Card Report” assessing the carrier's performance on the basis of a combination of, how well the ambient temperature is maintained during transport and the levels of consistency of early arrival. Armed with this information, the customer can make tactical decisions, based on temperature and delay alerts, as well as strategic decisions on partnerships with carriers. As a result, the company significantly improved the fulfilment of its Basic Performance Index (Key Performance Indicator Kpi).
Better quality through common data
An international fast food chain shares U.S. national quality and compliance data from Sensitech's reports to suppliers and distribution centers in weekly, monthly and quarterly basis for managing compliance with regulations and quality conservation. The customer even gives annual prizes, to encourage supply chain partners to make operational changes to improve performance.
By sharing this data, the customer was able to reduce the percentage of non-compliant shipments from 6,4% In 0,5% in just three years. This fast food chain has been diligent in taking steps to educate suppliers and take distribution centers on best practices. The company also makes frequent visits to suppliers and other continuous improvement activities.
The company is also in the process of merging quality data and complying with complaints from its restaurants to make the corrective action process more effective.
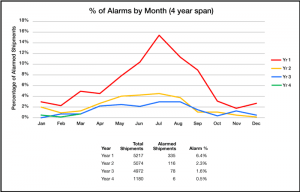
Image 1: This customer shares reports such as this, third parties involved, to improve their performance.
Improved route management
Sensitech has helped an international burger chain integrate cold chain monitoring into its supply chain management protocol and share responsibilities with its quality and supply chain management partners. Suppliers were given the task of recognising and experiencing real-time temperature alarms. All interested parties, which included suppliers, recipients and logistics managers, were responsible for monitoring shipments to cope with transit delays and any necessary rerouting of shipments. The company's logistics team was then able to use a Sensitech monitoring system to reveal how it should guide trucks during a hurricane that affected the majority of the U.S. East Coast

Image 2: Real-time data helped this company choose new, safer routes for the transport of its products.
Continuous improvement through trend analysis
For a product cooperative, long-term customer of Sensitech, the evaluation of historical data contributes to the continuous improvement of the cold chain of the. Sensitech has collected more than 12 years of historical data and combined them with four years of more recent real-time data, collected from newer IoT-based sensors. The data are collected and analysed to provide long-term benefits from a cold chain monitoring programme.
Historical data is used to measure non-compliant performance over time through the Basic Performance Index (Kpi), such as the average temperature as well as the rate and percentage of off-spec shipments. For example, as shown in the chart below, data show that the average temperature from month to month and year after year continues to decrease, which translates into improvement over time.
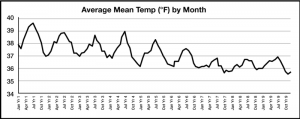
Image 3: This history analysis, helped the customer assess the continuous improvement year after year.
History data is also broken down by vendor, carrier and recipient. In one case, the data led to on-the-spot evaluations to identify the root causes of the problems. Data collected on the temperature of the product near the walls of the transport chamber, helped Sensitech discover that the product was improperly loaded into a truck and placed directly onto the walls of the truck. The company has been informed of the standard operating procedures of the (Sop) and made operational changes that eliminated these inappropriate practices.
The multi-level approach strategy delivers
As discussed in this series of articles, it's important, for companies that want to improve the quality of the supply chain, have a multi-fold approach to best practices for collecting, management and analysis of their data. As the examples of this series of articles show, data can lead to visibility in the supply chain, which is a strategic way to improve the quality and operational efficiency of the.
Source: Sensitech Inc..