



Thermal Mapping Studies: Data-driven approach for the analysis of key causes
Food
Many of Sensitech's customers®, rely on the Professional Services Group to obtain evidence-based information on the continuous improvement of their supply chains.
For example, food customers, are concerned about maintaining the quality of temperature-sensitive products, while in transit from source to consumer. Many of them asked us to discover the root causes of temperature overruns, which have caused damage to the product during the shipping process.
Others want to explore new approaches to improving product quality. For example, a large chain of fast-service restaurants, recently asked us to investigate the impact of a process variation on how some of its bakery products, specifically two types of sandwich breads, frozen and disposed of. The customer had frozen the buns in the bakery before the shipment and wanted to investigate what would happen if they sent the products fresh and frozen them during their transport. The freezing decision during transport needs careful consideration, as refrigeration equipment is usually suitable for maintaining the temperature of the product, during the trip, to save weight and fuel.
Determination of optimal freezing parameters
Previous Sensitech research has shown that it is important to minimise the length of time products stay, containing starch in a cooling environment, as cooling can speed up the. Therefore, we usually recommend bread:
- Store fresh at room temperature, where possible, increase the lifespan, or
- if the product is frozen, should be frozen and thawed quickly to minimise the time spent, in cooling conditions.
In conjunction with this research, other studies have shown that the use of refrigerated shipping containers for cooling or freezing of a product during transport, instead of maintaining the temperature, may be detrimental to the quality of certain products.
This particular customer wanted to test the quality impact of freezing his bread products during transportation at sea and understand if improvements could be achieved from time to delivery.
Use of thermal mapping for evidence-based evidence
The thermal mapping process for this particular scenario provided real-time data on:
- How long did it take to freeze the product?.
- If temperature uniformity is achieved in the package, during the shipping route.
- The overall impact of the process on the quality of the.
The process started on the spot at the supplier, an oven in California, where bread products were manufactured, were placed in plastic bags and, Then, in cartons. They were stored in ambient conditions in the bakery for 24 Hours, before being shipped by shipping company to the chain's distributor in the Hawaiian islands and then to its restaurants.
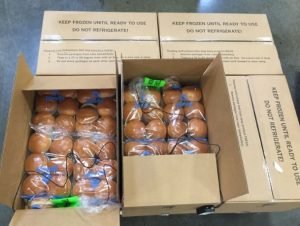
Image 1: Packed buns with recorders TempTale®
Before the products leave the oven, Sensitech was on site to strategically place 36 temperature recorders in product packaging. The cartons were then loaded into six pallets The team used a catheter recorder in the middle cartons of pallets and a double stainless steel catheter in the outer cartons. The double catheter recorders measured both the temperature of the product inside the cartons during the shipment, as well as the ambient temperature in the container.
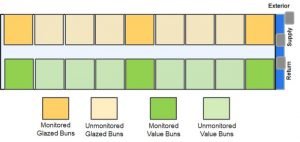
Image 2: Location of breads monitored and not monitored by bread type
The recorders collected temperature data from the moment the goods left the bakery in California, until they reach the distribution center in Hawaii. From the data collected during the shipping process, Sensitech found:
- At what temperatures were the products exposed #8216 throughout the transport period?.
- How quickly the products freeze and if they remained frozen throughout the #8216 entire duration of the shipment.
- How the freezing differences arose) in each individual palette and b) based on the position of the pallet inside the container.
- How the process affected the product on arrival as the final destination.
Led to better results with real-time data
Thermal mapping study gathered real-time data throughout mission journey. The data was correlated with our customers' goals. For example, the standard temperature used by this customer to freeze his product was 20 ° F. We related this to the container setpoint -10 ° F, reached on the second day of travel.
Here's an overview of what we've discovered in relation to these defined settings points:
- During the seven-day mission, there were variations in ambient temperature in all cartons, floor to ceiling, with the cartons in the middle of the pallets remaining the coldest.
- There were daily variations in product temperature over time, From 75 ° F initially in the bakery up to, In some cases, under -5 ° F, which occurred on the 7th day of the mission.
- The product near the core of the pallets reached the ideal 20 ° F on average 1,9 days. The highest level of achieving this temperature in 3,8 days for a product and 2,6 days for another. The product in the corners reached this temperature in 0,7 days.
- Applying a weighted average, the data showed that the time it takes to reach the average volume within the carton in the 20 °F took about two days.
- Regardless of the type of bread, the time to 20 ° F varies widely in all cartons and depends more on the position of the product inside the pallet than on the position inside the cartons.
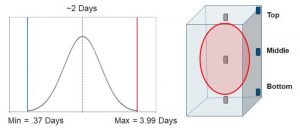
Image 3: Chart showing the amount of time it takes for the buns to reach their 20 ° F
Better decision-making and improved product quality
On the basis of the data collected and the on-the-spot observations, Sensitech provided the fast-service restaurant chain with information that would help them decide whether to further explore this option. Sensitech offered several suggestions on how, overall results and product quality could be improved, if the customer follows this approach,
Format Load
- There could be more uniform temperatures in all cases, if the airflow increased between the pallets, adjusting the loading configuration to reduce the open floor space in the container. Usually, cold air flows from the floor of a container to the roof, following the path with less resistance. Therefore, when the amount of empty space in the trailer is reduced, the air is forced to flow through the pallets and not the open spaces
Packaging
- These specific products were wrapped in film shrinkage in pallets. Using angular plates and pallet straps instead of shrinking membrane, pallets would be kept in place during transport and would allow increased airflow through cartons and faster freezing of products.
- Because the products were on cardboard with minimal openings, there was limited airflow. An optimal option would be for cardboard boxes to have holes (Airways) or reusable plastic case (Rpc). Both of these solutions, would have increased air circulation and uniformity of the product temperature throughout the pallet.
Product Location
- The product found in the middle layer of cartons at the core of the pallets took up to two days longer to freeze compared to the outer sands of the pallet. The use of "chimney" in the center of the pallet would increase the flow of air through the nuclei and reduce freezing times.
With this information, the customer can now make a more informed decision as to whether the tried and tested procedure, with these additional recommendations, would be a passable process that would proceed. The chain can weigh whether the freezing of the products during transport and not before shipment significantly improved the overall process without compromising the quality of the product on arrival at its restaurants.
For more information contact us Here.
Source: Sensitech