
SensiGuard® Q2-2019 Report: The Top Place Food Thefts & Beverages in the United States.
SensiGuard® Q2-2019 Report
SensiGuard® Q2-2019 Report: The center SensiGuard® Supply Chain Intelligence Center (Scic) actively monitors and records cargo theft around the planet. Categorizes stolen shipments into twelve different product types and detects by date, Location, operating system (Modus Operandi), value and specific product. On a regular basis, issue safety bulletins and cargo theft reports. That's how we help companies mitigate the risks., linked to theft, the alteration, counterfeiting, the diversion, embezzlement and other threats to cargo safety.
On 11 October we shared Sensitech's findings, for the continuous increase in cargo thefts in Mexico. SensiGuard® Q2-2019 Report. This week we're sharing some second-quarter data., recent incidents in the United States. You can have a full report and latest updates for the United States., Canada and other regions of the world, by visiting the centre's website: SensiGuard Supply Chain Intelligence Center:
Theft of Cargo in the United States In the second quarter of the 2019 – Q2-2019
This is our second part., of a series of four publications, which we will share from the information report of the SensiGuard™ Second Quarter of a 10 Supply Chain Intelligence Center Center (Scic) highlighting a different area at a time.
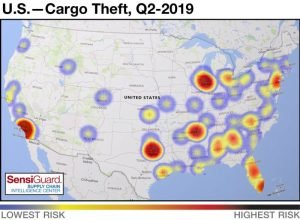
Clues on the map of the United States
The SCIC centre recorded a total of 144 incidents of theft in the United States. Q2-2019.The average loss in value per incident was $118,496, which is just the 1% reduction in volume and a 2% increase in value compared to the previous quarter.
There should also be a theft worth more than $1 million was recorded during the 2Th quarter of the 2019. They were mentioned, two in 2The quarter of 2018 according to the publication of this report.
Here are the most significant increases in cargo theft by category for April to June 2019:
- Product Type: Food Theft & Drinks increased, covering the 27% total thefts and ensuring first place for the first time, from the 2nd quarter of 2016. The theft of Home Products & Garden claimed the second point with the 15% all thefts in Q2-2019.
- Situation: As usual, California continues to hold the top position for cargo theft with the 21% total thefts. The theft rate has decreased, However, When 16% in the first quarter of the 2019 And 25% in the second quarter of 2014, 2018. The most common thefts in California were in Food & Drinks (30%), follow ed by The Electronic (27%).
- Location: The most widespread site for large-scale cargo theft, continues in this quarter, be in unsecured parking, calculated at a rate of 86% of incidents.
yet
- Event Type: Incidents involving the complete theft of road cargo, continued as the most widespread method of theft during this quarter, with the 60% all reported thefts and with an average value of losses in $109.944. Petty theftcontinues to break records, taking top spot on the list for the fifth consecutive quarter. It is calculated in the 35% total thefts for Q2-2019. The average value is also a new record in $ 151.641.
- Product and Value: With the 72% thefts in Q2-2019, the average injury in all incidents was $118,496, I.e 2% lower than Q1-2019 and 34% higher than Q1-2018. Medicinal products recorded the highest average value in this quarter with $361.957, mainly due to the amount of $600.000 + small supply thefts in California. The average value is 262% higher than Q1-2019 and 37% lower than Q1-2018. Extra, building blocks & Industry, electronics, household products & gardening products and metals increased their average value in the first quarter of 2014. 2019 and the second quarter of 2018, increasing by increasing 247% And 126%, 174% And 57%, 13% And 12%. And 186% And 223% Respectively.
Looking for load theft prevention solutions and monitoring solutions;
Ask for information on how sensitech's Global Supply Chain Information Group, can obtain load history data and deliver it to you through SensiGuard Secure Control Panel and Sensitech Analyst-on-Demand Service. Contact one of our experts today to help you find anti-theft solutions designed for your specific business needs.
If you missed our previous post read it now: SensiGuard® Report Q2-2019: Mexico's Cargo Theft Threats Continue to Rise
Editor's Note: Delays in reporting incidents usually cause measurable increases in theft volumes in the weeks after scic quarterly reports are published. Therefore, totals for the most recent quarter are expected to rise above those recorded so far. It is scic's practice to use updated theft numbers for previous quarters, when comparing them to current three monthly quarter totals.
Source: Sensitech Inc. / ©2019 Sensitech Inc. All Rights Reserved.